
Today we’re opening AGEYE Market Intelligence to every grower, free. It’s a web app that turns the US Department of Agriculture’s daily terminal market reports into a pricing desk. It shows what buyers actually paid for your crop this week in every US terminal market USDA reports on, down to the variety, converted to a price per pound wherever the pack carries an honest weight. There’s no subscription, no credit card and no trial period. Start without an account, or take two minutes to sign up for the whole desk.
Free · no sign-up
Today’s wholesale prices
- Median price per pound for every crop
- Every terminal market ranked, highest-paying first
- A year of weekly prices
Free account · 2 minutes
The full pricing desk
- Prices for each variety, not a crop average
- A quote checker that shows what your price is worth a year
- Market and crop comparisons, trends and CSV export
- Insights: unusual moves, tightening supply, grocery ads, the calendar
- A Today brief built around your crops and markets



Pricing Is the Decision Growers Make With the Least Information
A modern grower can measure almost everything inside the farm: vapor pressure deficit, daily light integral, yield per square foot, cost per pound. The number that decides whether any of it pays is the price, and it usually comes from somewhere much shakier: a buyer’s first offer, last season’s invoice, or a guess.
The data to do better already exists. USDA’s Agricultural Marketing Service publishes terminal market reports every trading day, recording what wholesale buyers actually paid in the country’s big produce hubs. But it arrives as raw text, mixing 10 lb cartons, 4 lb cartons, bunches, film bags and count packs across hundreds of lines a day, with no price per pound. Turning it into a number you can quote takes hours each week, so most growers never do it.
There’s a second trap, too: averages. Inside a single crop, prices run roughly five times apart by variety. Enoki and white button are both “mushrooms”, and oak leaf red and romaine hearts are both “lettuce”. A blended mushroom price runs 46–77% low for specialty types, so a grower who prices off it gives that difference away on every case.
AGEYE Market Intelligence does that work for you, every trading day.
What a Free Account Unlocks
The public price pages answer “what is my crop worth today?” A free account answers the next questions: what is my variety worth, is my quote right, where should I sell, and what’s about to change.
1. A quote checker that grades your price before you send it
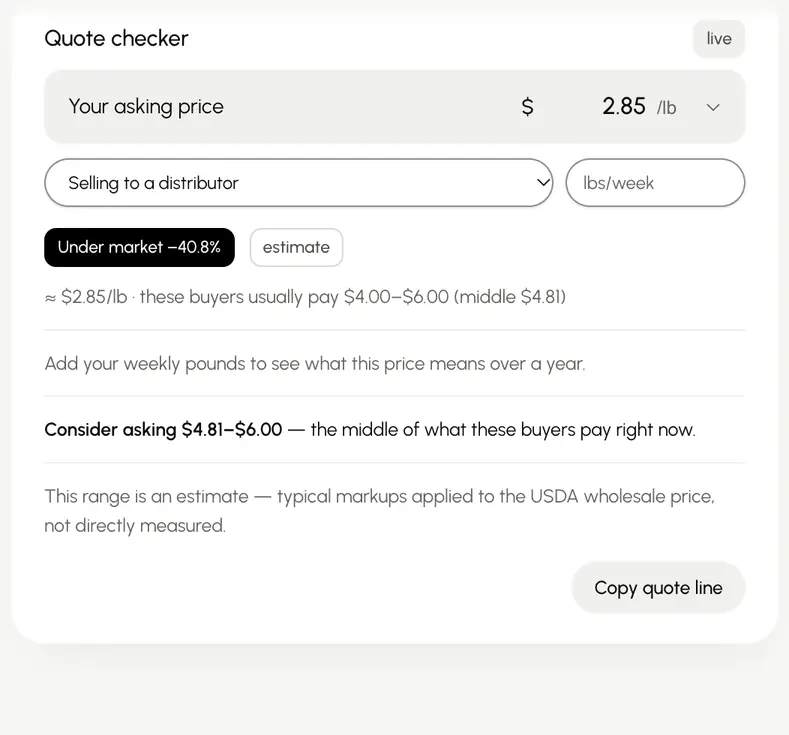
Type the price you’re about to offer, pick who you’re selling to and enter your weekly volume. The quote checker places that price inside the range those buyers are actually paying right now, and translates the gap into dollars a year.
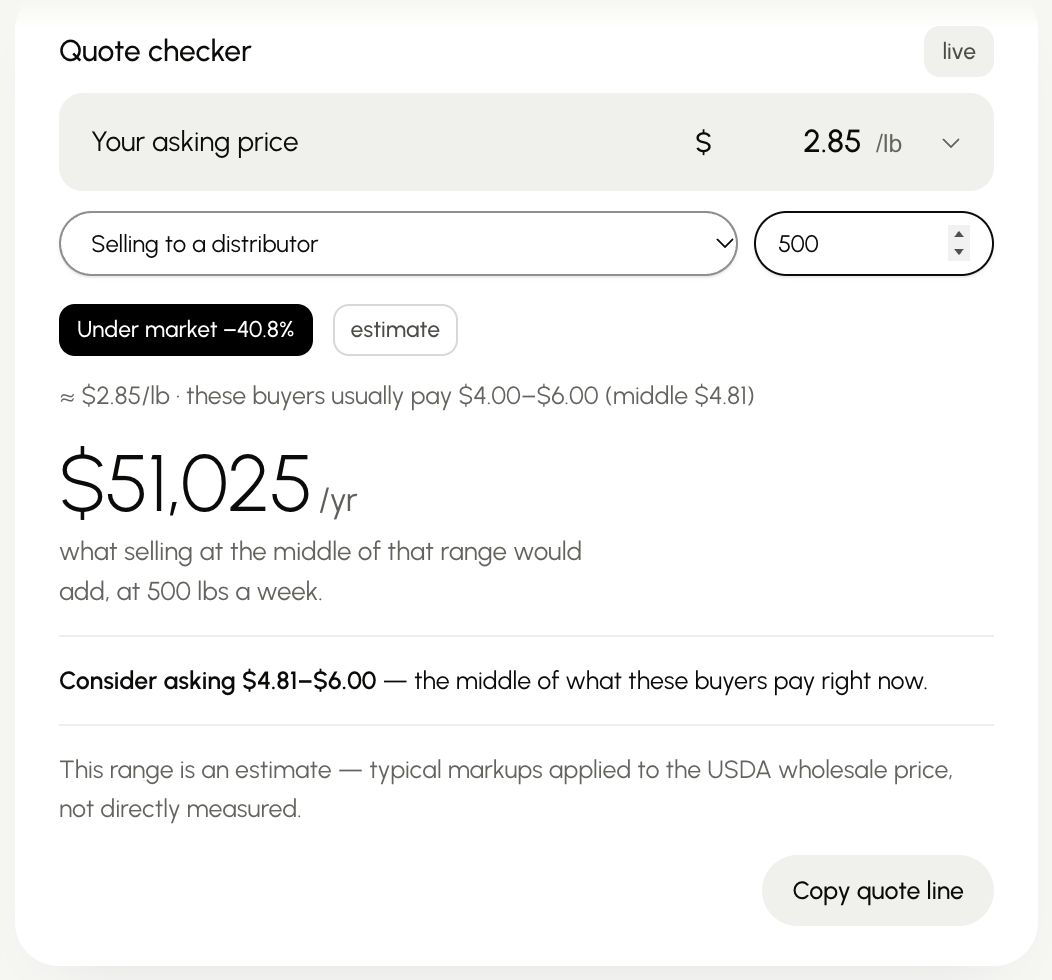
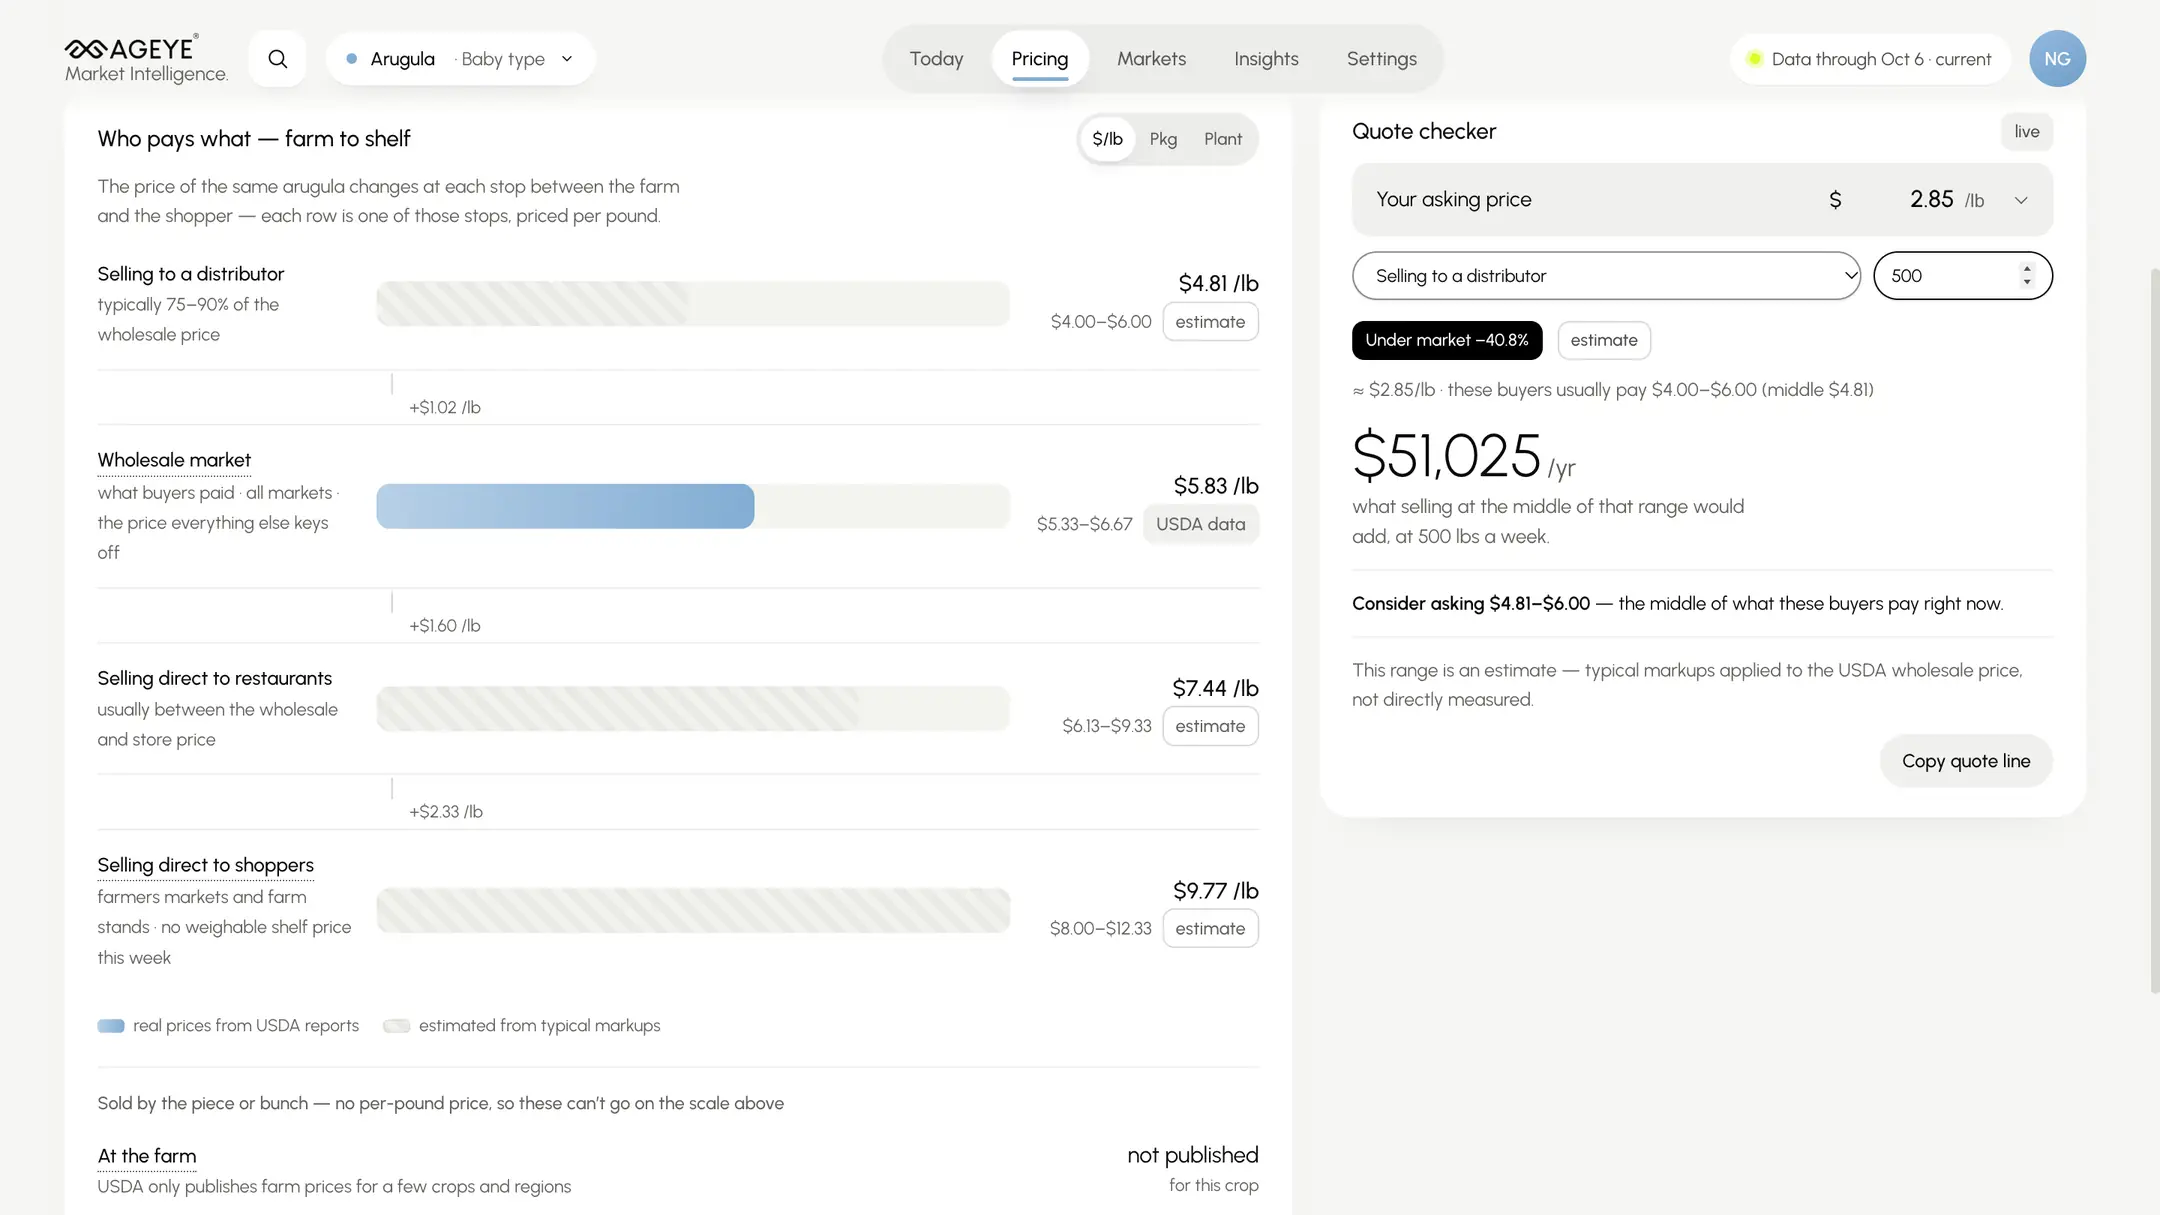
In that example, the grower was about to quote baby arugula at $2.85/lb. Distributors were typically paying $4.00–$6.00, so the quote came back 40.8% under market. At 500 lb a week, pricing at the middle of that range is worth $51,025 a year. The checker suggests a price to ask for instead and gives you a quote line you can copy straight into an email. The app is upfront about where its numbers come from: the distributor range is an estimate built from typical markups on the measured wholesale price, and it’s labeled that way on screen.
2. Who pays what, from the farm to the shelf
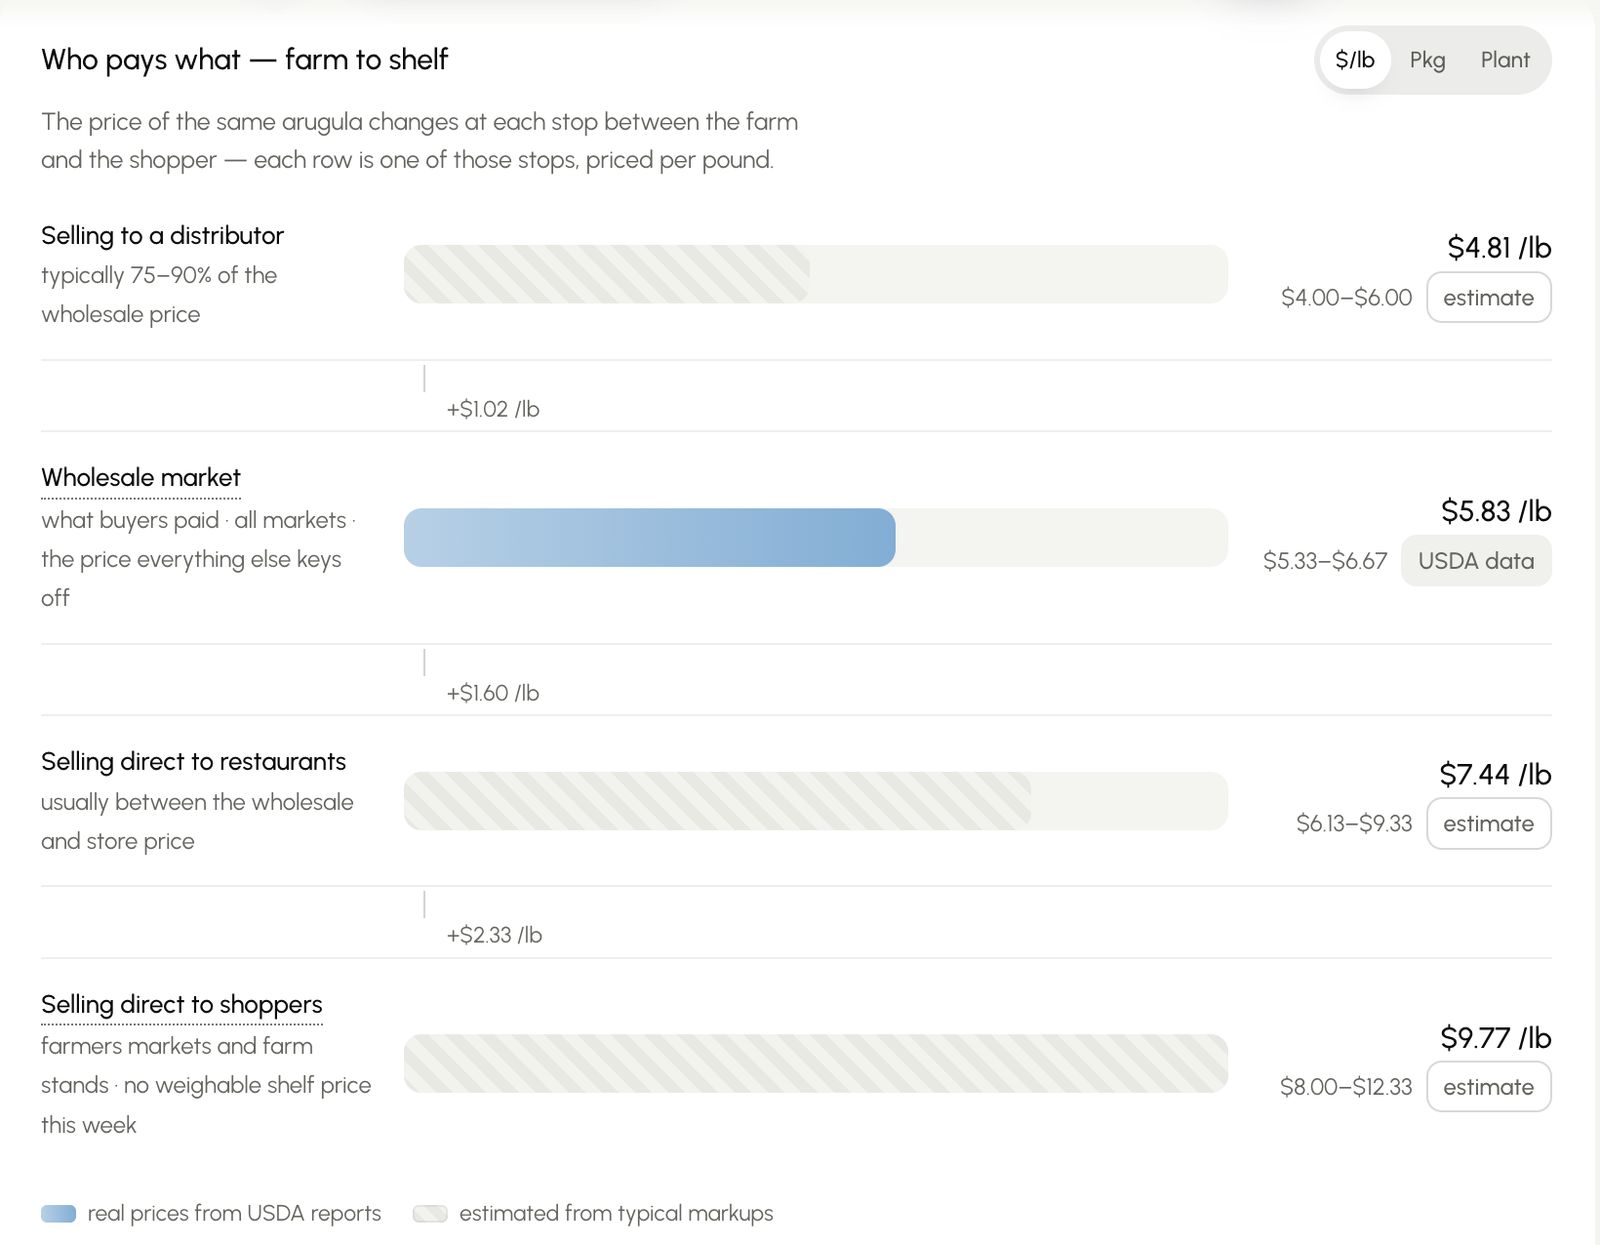
The same pound of arugula is worth a different amount at every stop between your farm and a shopper’s basket. The Pricing Desk lays out that ladder: selling to a distributor, the wholesale terminal market, selling direct to restaurants and selling direct to shoppers. The wholesale rung comes straight from USDA, and each estimated rung is marked as an estimate. Switch between price per pound, per package and per plant, whichever matches how you sell.
3. Where your crop pays the most
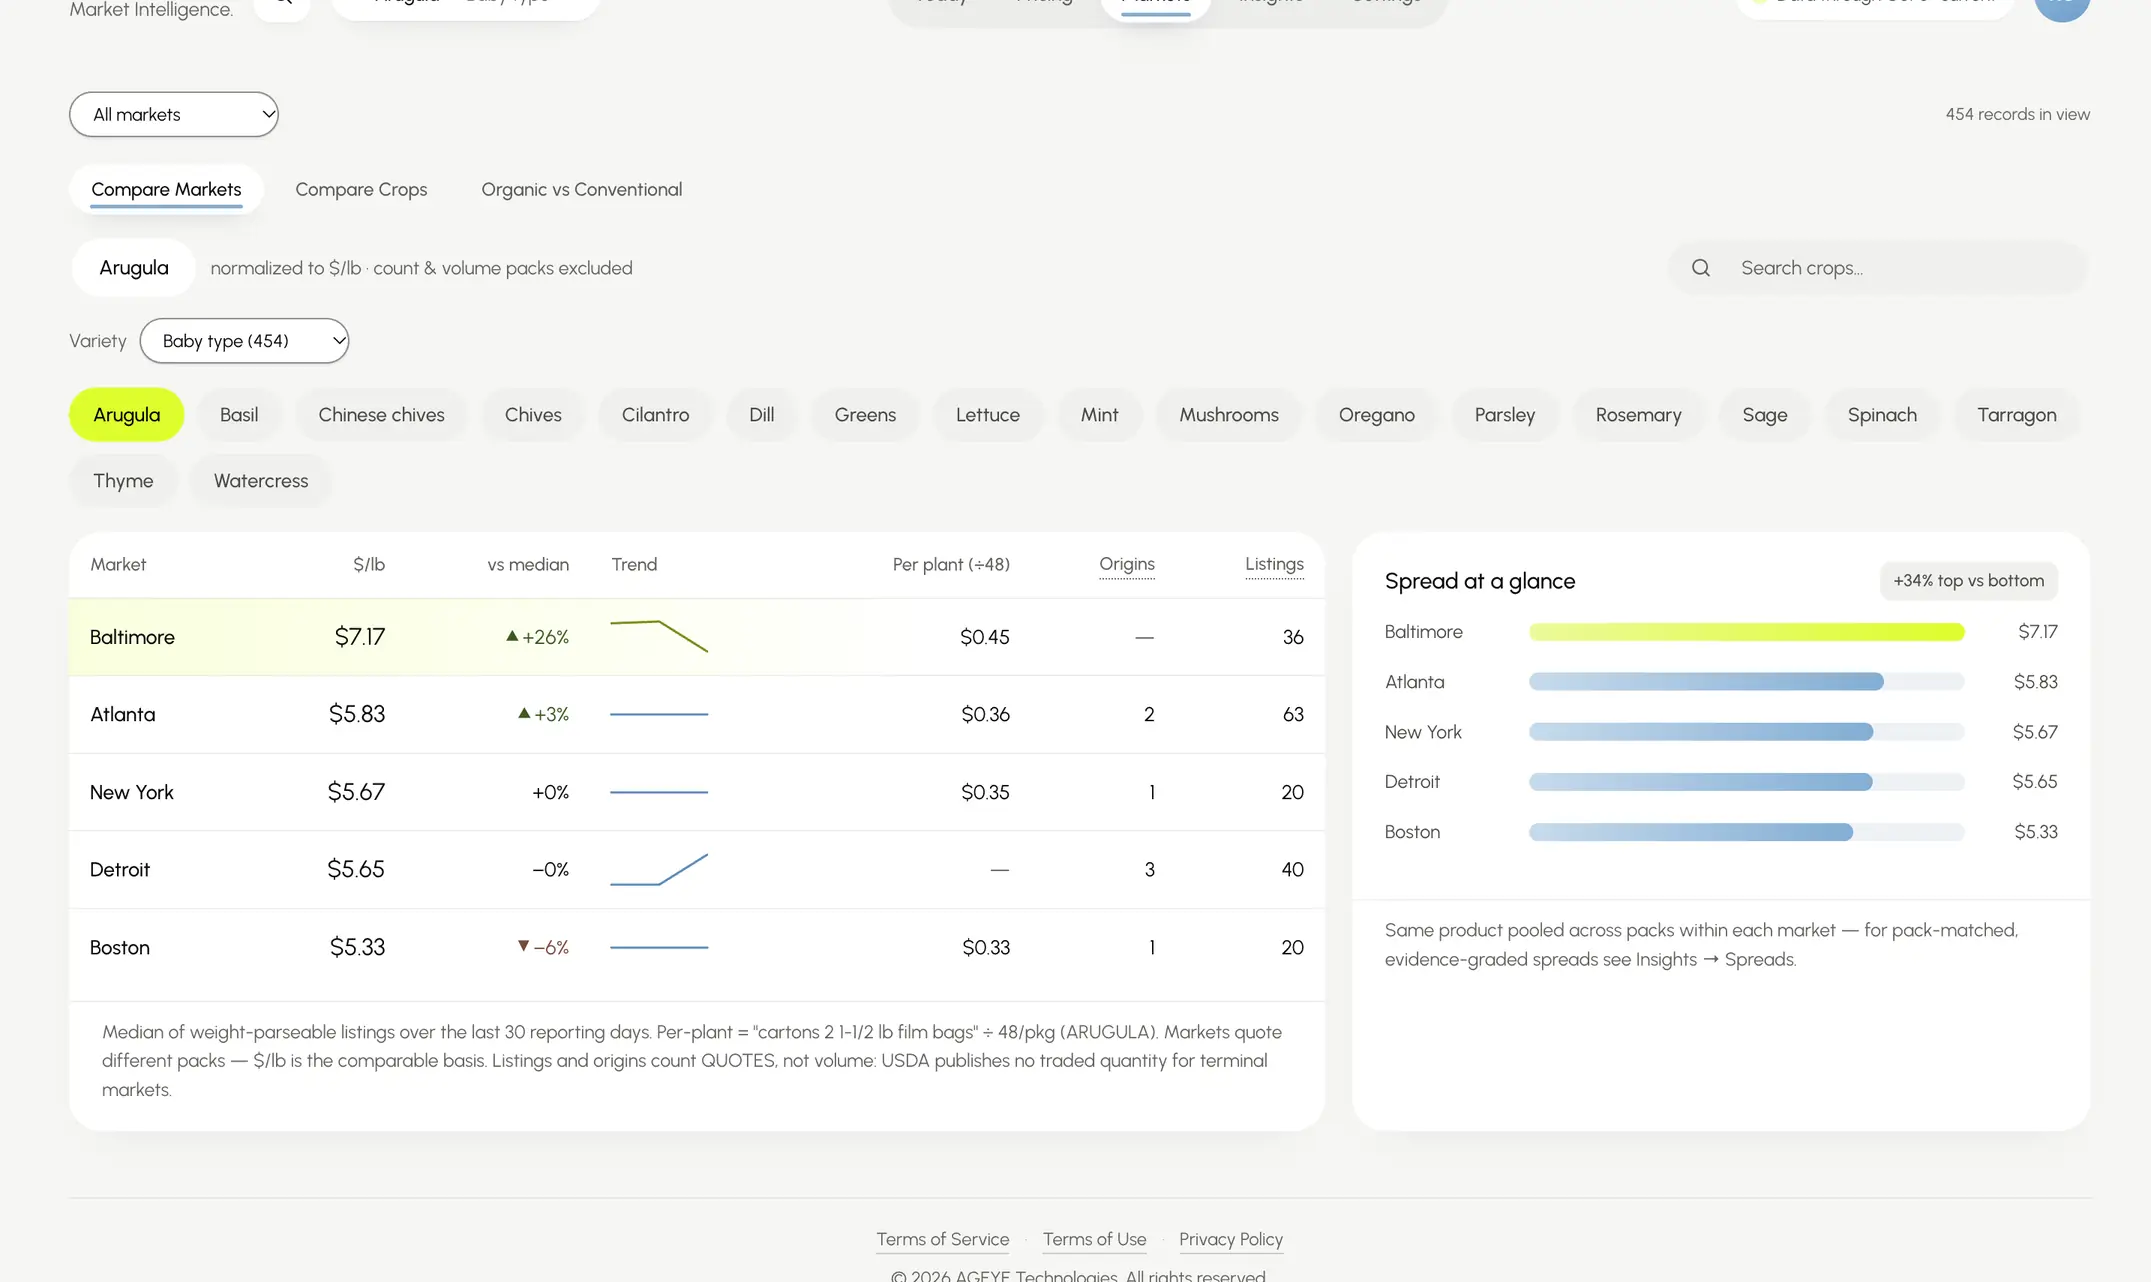
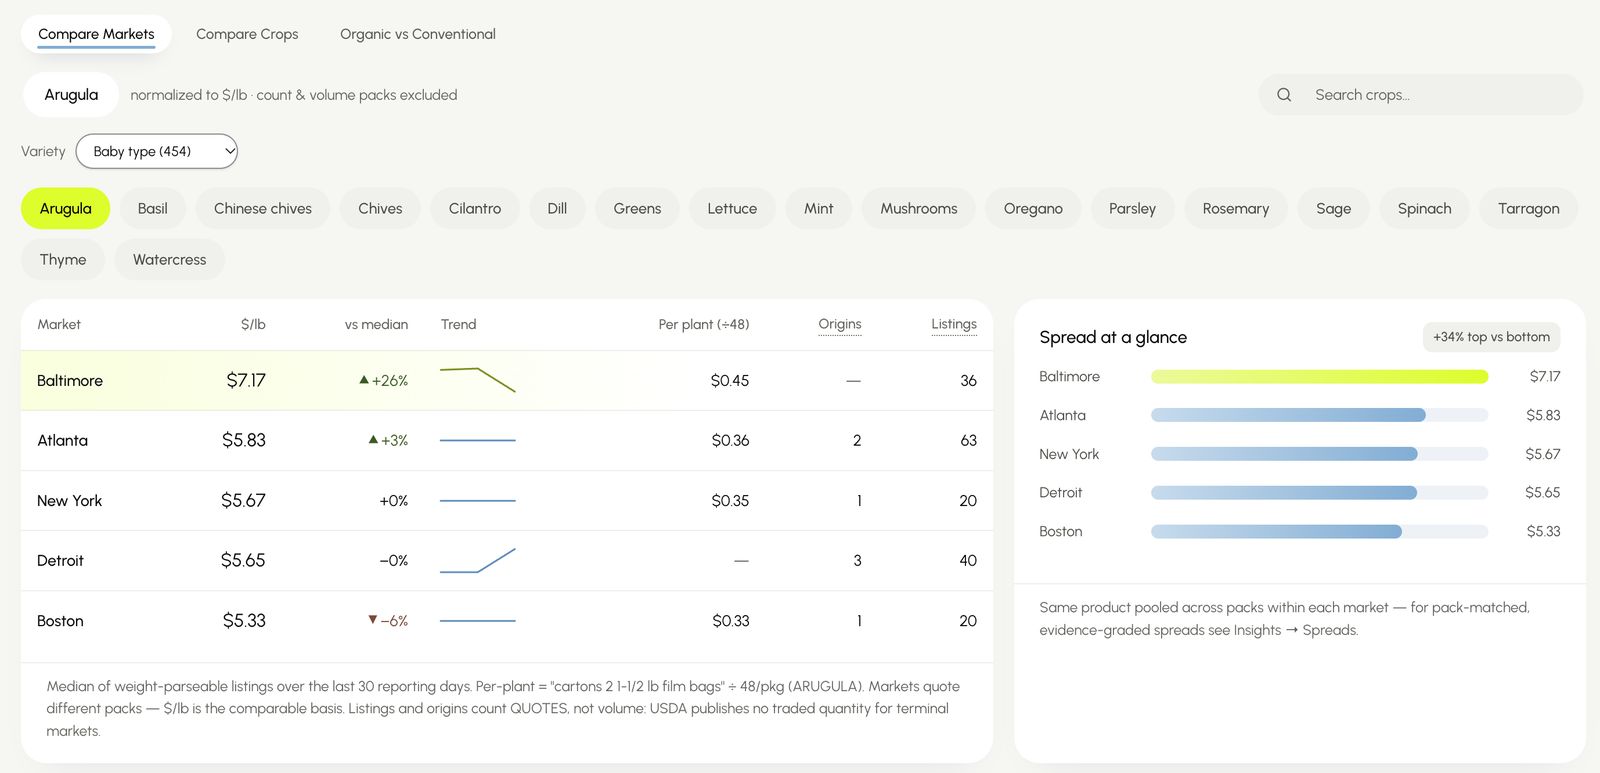
Compare Markets ranks every terminal market for the crop and variety you grow, converted to a price per pound so different pack sizes compare fairly. Over the last 30 reporting days, the median price for the same baby arugula was $7.17/lb in Baltimore and $5.33/lb in Boston, a 34% spread. If you can reach more than one market, that spread is a decision. Two more views sit alongside it. Compare Crops puts up to six crops or varieties on one chart, the quickest answer to “should I grow more of this?” Organic vs Conventional measures the organic premium pack for pack instead of assuming a markup.
4. Price trends for every crop on one chart
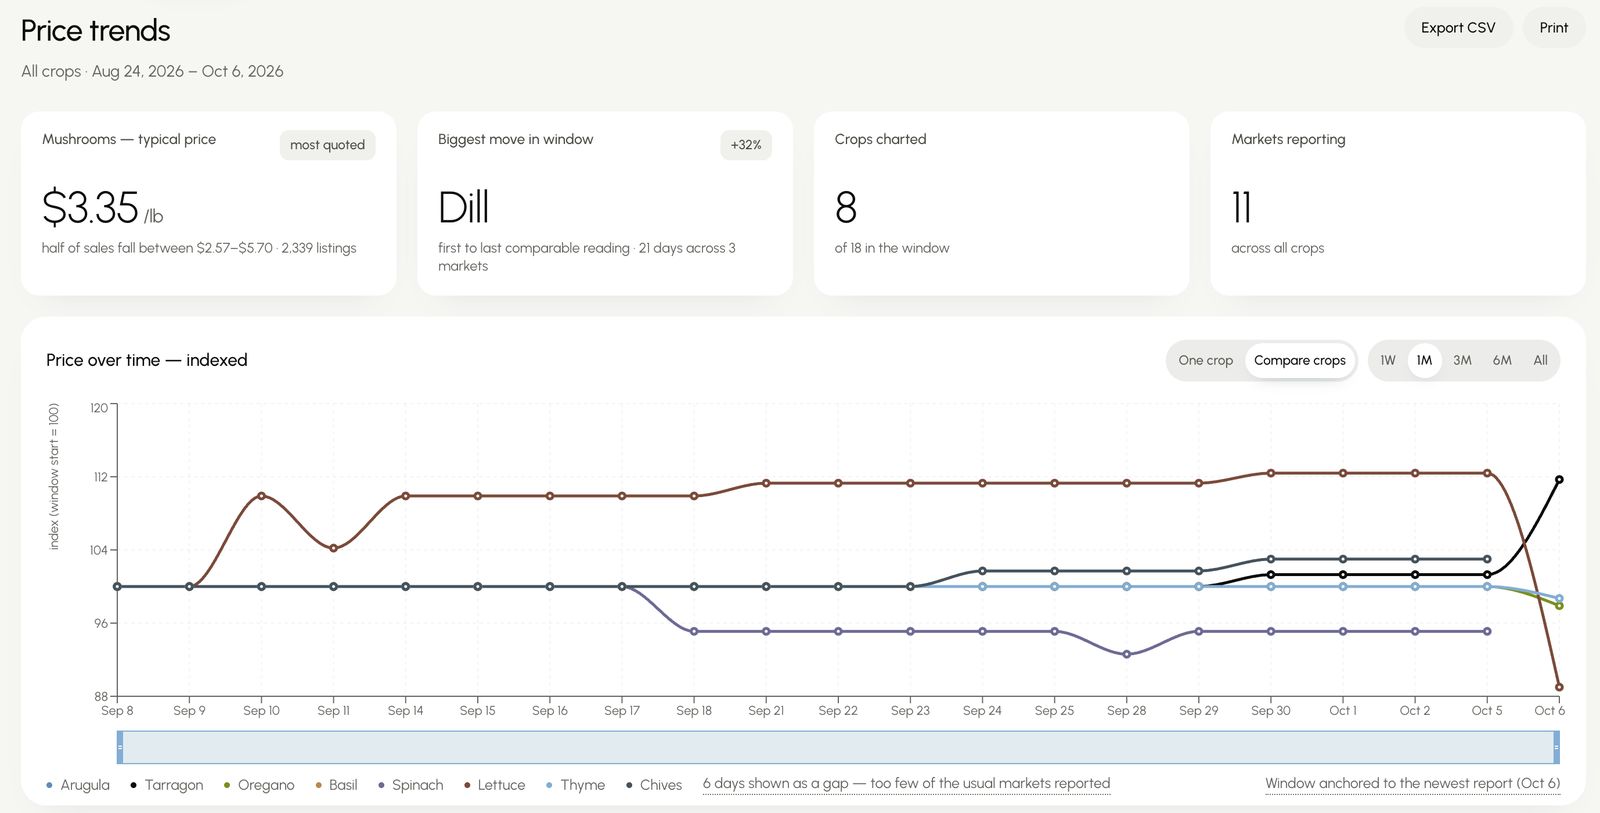
Price Trends charts a single crop in dollars, or indexes every crop to the start of the window so their moves line up side by side. Ranges run from one week to the full history, and any view exports to CSV for your own models. In the six weeks to October 6, the biggest mover was dill, up 32% from its first comparable reading to its last.
5. Insights: what changed, and what to do about it
Insights reads the reports so you don’t have to, and surfaces the few things worth acting on.
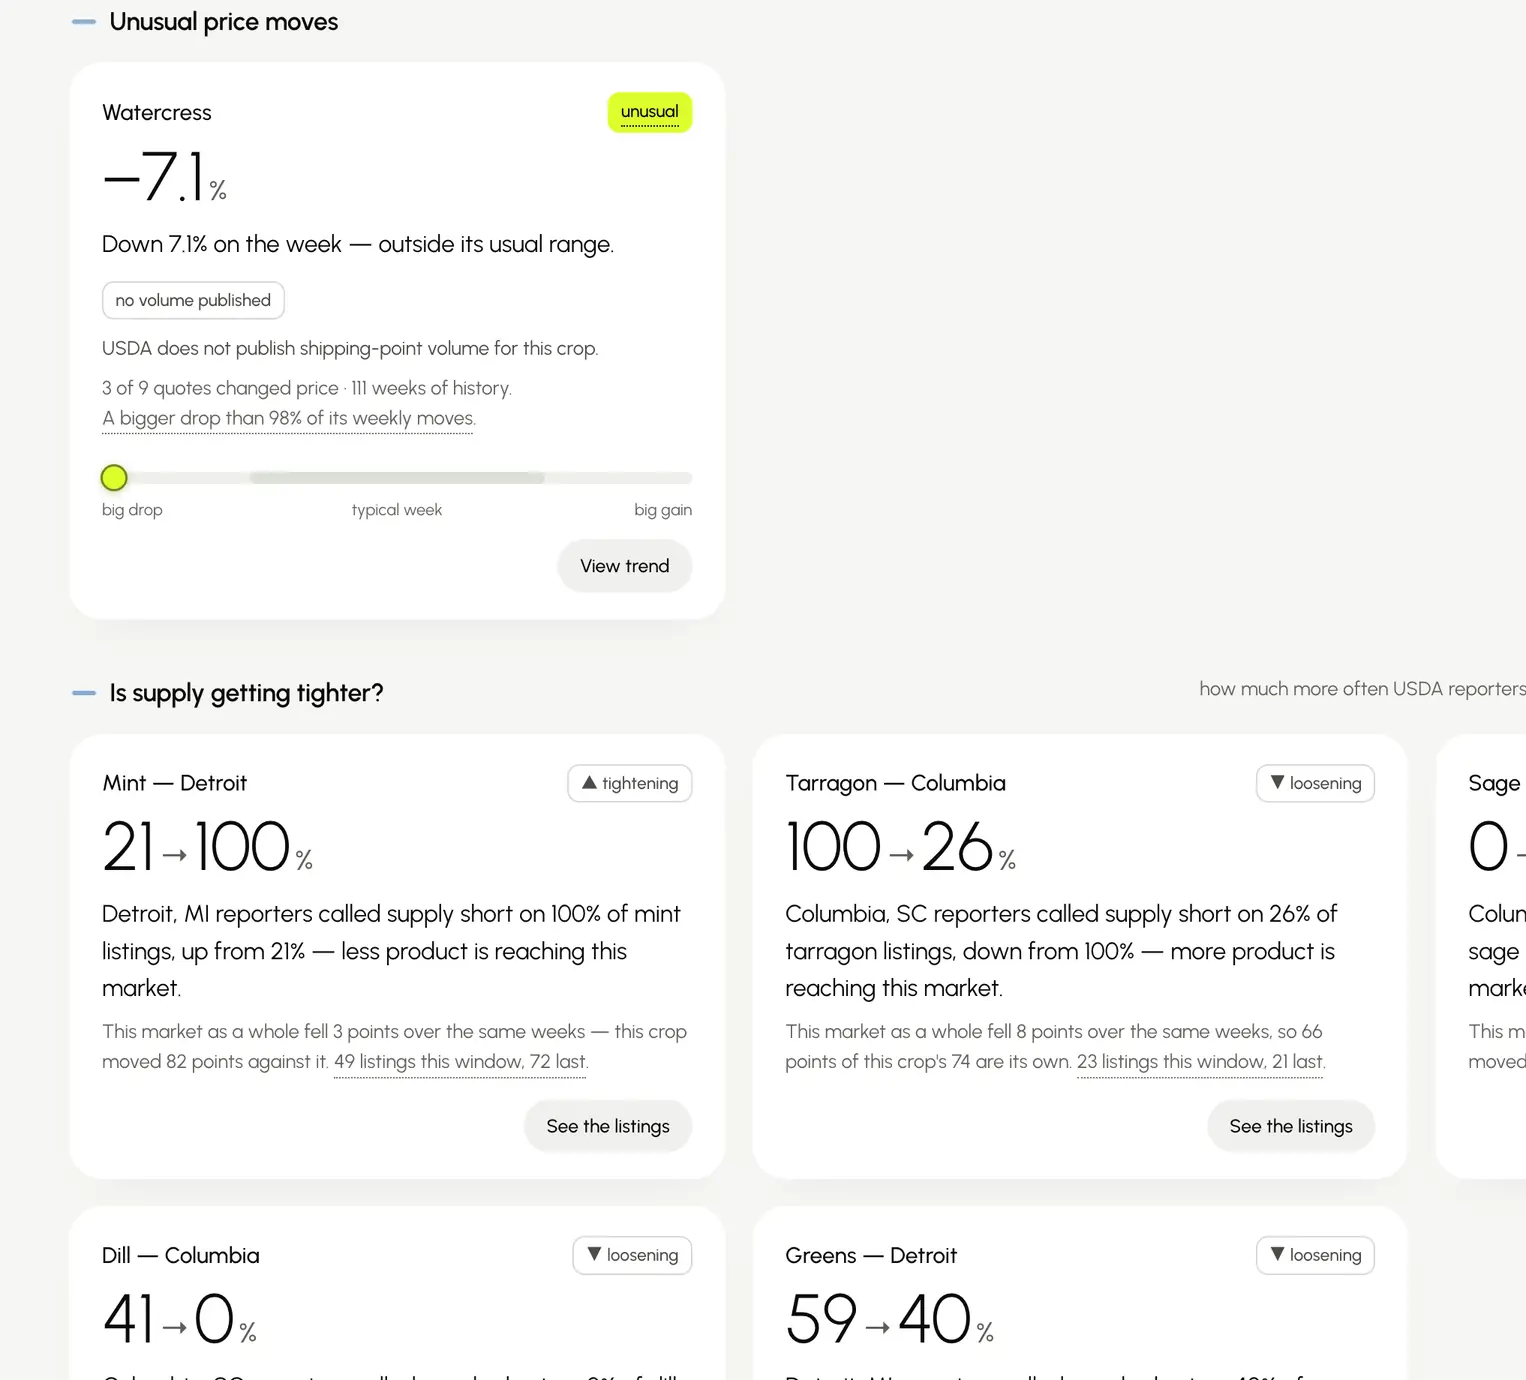
- Unusual price moves are judged against each crop’s own history, never a generic threshold. Watercress fell 7.1% in a week, a bigger drop than 98% of its weekly moves over 111 weeks of data.
- Supply tightening tracks how often USDA’s market reporters note that supply is short. In Detroit, reporters called mint short on 100% of listings over the last 30 days of reports, up from 21% in the 30 days before: less product is reaching that market.
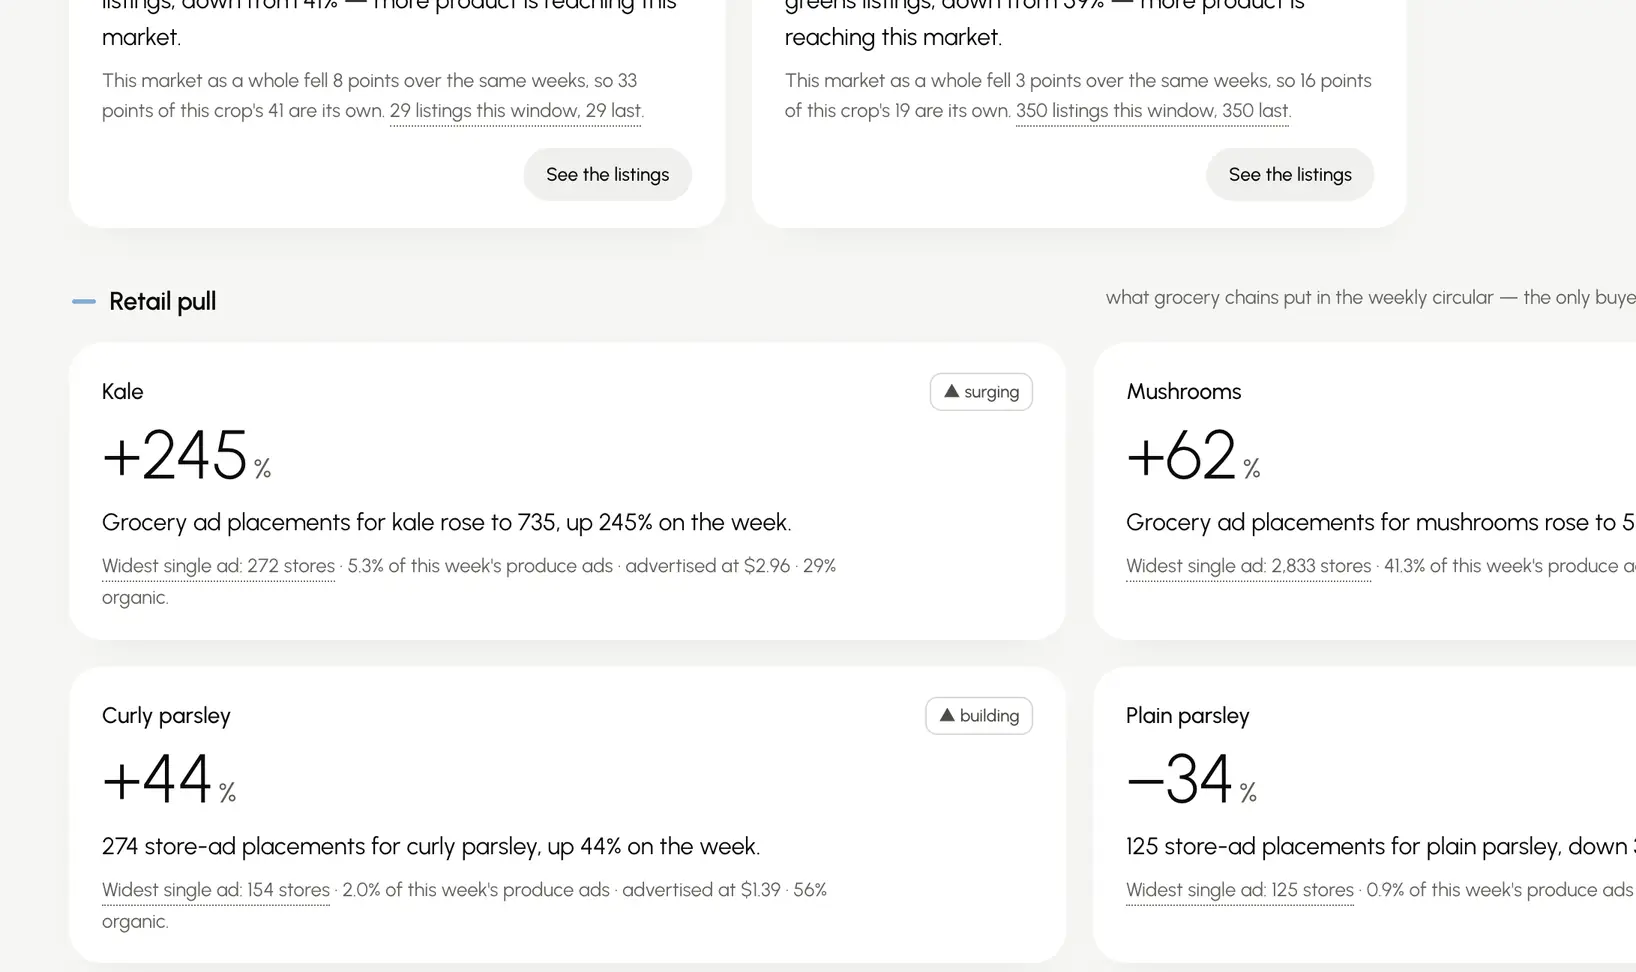
- Retail pull shows what grocery chains are putting in their weekly circulars, the one buyer-side signal in the app. Grocery ad placements for kale rose 245% to 735 in the week of September 26, and mushrooms rose 62% to 5,764.


6. A calendar that sees the supply gap coming
Some price moves come on schedule. The market calendar lists the events that move produce prices, each with a playbook for what to do when it hits: the Salinas-to-Yuma growing transition, when field supply of leafy greens dips; the Thanksgiving window, when retail ads lean on sage, thyme and rosemary; disease pressure like INSV in the Salinas Valley; and trade policy such as the antidumping duty on Mexican tomatoes. Plant for the gap, and you’re selling into it rather than reading about it.

And the rest of the desk
- Today is a one-screen brief on your own crops: your lead crop’s price, the best move this week and where to sell, with freight netted out of each market.
- Per-plant pricing is for growers who think in towers and plant sites rather than cartons. Each package converts to a price per plant using a plants-per-package figure you can adjust, and crops with no plant basis, such as mushrooms, say so instead of inventing one.
- Seasonality shows each crop’s strong and weak months, so you can choose a selling window before you commit a planting.
- Plain language throughout. Tap any term for its definition, and every figure says what it’s based on.
Live: What These Crops Are Fetching Today
The table below isn’t a screenshot. It loads from the app every time this page does, so it shows the latest wholesale prices USDA has published.
Built on the Market’s Own Numbers
Every price in AGEYE Market Intelligence is a real reported sale from the USDA Agricultural Marketing Service Terminal Market reports. None of it comes from a survey or a model. The app holds more than 350,000 of those records and refreshes every trading day.
Markets (11): Asheville, Atlanta, Baltimore, Boston, Chicago, Columbia (SC), Detroit, Los Angeles, Miami, New York and Philadelphia. That’s every US terminal market USDA currently reports.
Crops (18): arugula, basil, chives, Chinese chives, cilantro, dill, greens, lettuce, mint, mushrooms, oregano, parsley, rosemary, sage, spinach, tarragon, thyme and watercress. Each is tracked down to the individual variety.
Three rules keep the numbers honest:
- It describes the market; it doesn’t predict it. The app shows the range sales actually fell in and where your price sits inside it. Nothing is forecast, and nothing is invented.
- No weight, no per-pound price. Some packs carry no honest weight. Parsley, watercress and Chinese chives, for example, are quoted only in bunches or counts. The app says so instead of dividing by a guess.
- Measured and estimated never blur. USDA-measured prices and estimated ranges look different on screen, and every estimate says how it was made.
Why It’s Free
Pricing shouldn’t be the part of farming that runs on guesswork. AGEYE builds the intelligence layer for controlled-environment agriculture. That includes HYVE vertical farming systems, Digital Cultivation farm management software and CultivAid, our agentic AI for indoor farms. Market intelligence is the layer that ties what you grow to what it sells for. The underlying USDA data is public. What was missing was a way to use it in the minute before you send a quote, so that’s what we built, and we’re giving it away. Growers who price on real numbers build farms that last, and that’s good for everyone working to make indoor and local agriculture pay.
Who It’s For
- Vertical farms, container farms and greenhouses selling leafy greens, herbs or mushrooms into wholesale, foodservice or retail.
- Field and small-acreage growers of the same crops who want a benchmark before they negotiate.
- Food hubs, distributors and buyers who want to see where a price sits against the terminal market.
- Planners, lenders and analysts modeling indoor farm revenue. Pair it with the free Crop Profitability Tool.
Get Started in Two Minutes
- Look first, no account needed. Browse today’s wholesale prices by crop and market at wpp.ageyetech.com/prices.
- Create your free account at wpp.ageyetech.com to unlock variety-level prices, the quote checker, comparisons and insights. All it takes is your name, an email address and a mobile number.
- Pick your crops and markets so the Today brief and the rankings speak to your farm.
- Check your next quote before it goes out.
It runs in any modern web browser. There’s nothing to install and nothing to configure. To see how the pieces fit, read the Market Intelligence overview.


